DATA VISUALIZATION
In addition to the management system, the DMSW system has monitoring functionalities that can be monitored via the open source application Grafana.
Grafana
Grafana is a cross-platform open source application for the graphical representation of data from various data sources such as InfluxDB, MySQL, PostgreSQL, Prometheus and Graphite.
The recorded raw data can then be output in various display formats. These can then be combined into so-called dashboards. The display options and data sources can also be expanded using plug-ins.
Example of a Grafana dashboard
Grafana is often used for monitoring applications and supports the three pillars of observability: metrics, logging and tracing, but can also be used to display static data in relational databases.
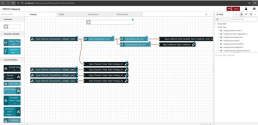
PROTOCOL CONVERSION
MAPPING CONCEPT NODE-RED
An exemplary mapping via Node-Red with a simple and flexible export function.